MS Excel Interview Questions for Data Analysts with Practical Examples
In today’s data-driven world, MS Excel is one of the most important skills for a data analyst. No matter how advanced tools like Python, SQL, or Power BI become, Excel still remains the foundation of data analysis in most companies. From small startups to large enterprises, Excel is widely used for data cleaning, analysis, reporting, and decision-making.
When you attend a data analyst interview, interviewers do not just check whether you know Excel formulas. They want to understand how well you can use Excel to solve real business problems. That is why they ask both basic and advanced Excel interview questions for data analyst roles.
Why MS Excel Is So Important for Data Analysts
Before jumping into Excel interview questions and answers for data analyst, it is important to understand why Excel plays such a big role in data analyst jobs.
Excel is easy to learn and widely available in all organisations
It helps in cleaning messy and unstructured data
Excel formulas and functions save time and reduce manual work
Pivot Tables allow quick data summarisation
Charts and dashboards help present insights clearly to management
Because of these reasons, MS Excel interview questions for data analyst roles are asked in almost every interview.
Basic Excel Interview Questions for Data Analysts
Q1. What is MS Excel?
MS Excel is a spreadsheet application developed by Microsoft that is used to store, organise, analyse, and visualise data. In Excel, data is arranged in rows and columns, which makes it easy to read, update, and process. For a data analyst, Excel is not just a data entry tool; it is a complete analysis platform.
Analysts use Excel to clean raw data, apply formulas, perform calculations, find trends, and prepare reports. Excel also supports charts, pivot tables, and advanced tools that help convert raw data into meaningful business insights.
Q2. What are cells and ranges in Excel?
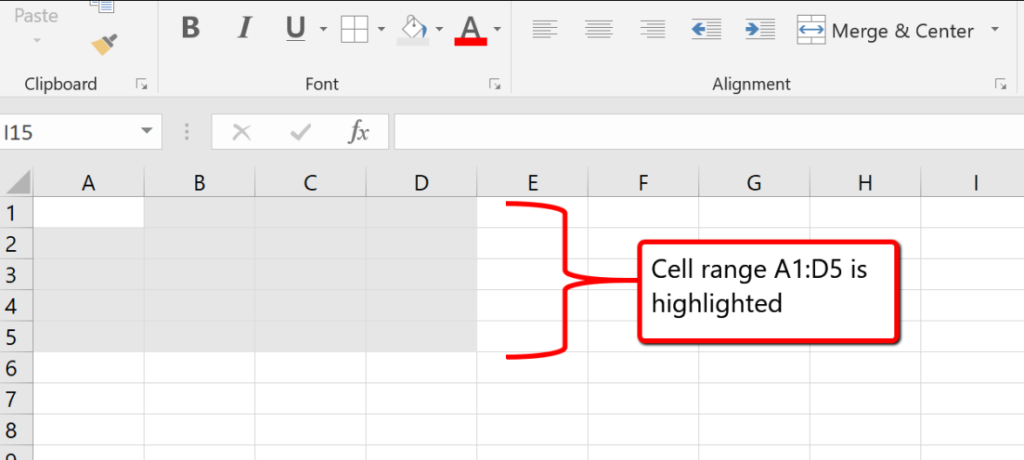
A cell is the smallest unit in Excel where you enter data. It is formed where a row and a column meet. Each cell has an address, such as A1 or B3.
A range is a group of cells selected together, such as A1:A5. Ranges are useful because Excel formulas and formatting typically work on multiple cells simultaneously.
Example:If cells A1 to A5 contain marks of students, you can calculate the total using this formula:
=SUM(A1:A5)
Q3. What are rows and columns in Excel?
In Microsoft Excel, rows run horizontally and are identified by numbers like 1, 2, and 3. Columns run vertically and are identified by letters such as A, B, and C. Together, rows and columns form a table-like structure that helps organise data clearly.
Example: In a sales sheet, each row may represent one customer transaction, while each column stores details such as name, date, or amount. This layout makes data analysis simple, structured, and easy to understand.
Q4. What is a workbook and worksheet?
A workbook is an Excel file that contains one or more worksheets. A worksheet is a single sheet within the workbook where data is entered and analysed. For example, a sales workbook may have separate worksheets for customer data, monthly sales, and yearly revenue.
Data analysts use multiple worksheets to organise data neatly, separate raw data from processed data, and maintain clarity while working on large projects.
Excel Formulas and Functions Interview Questions
Q5. What is a formula in Excel?
In Microsoft Excel, a formula is an expression used to perform calculations. Every formula starts with an equal sign (=) and can include numbers, cell references, operators, or functions. For example, formulas help calculate totals, averages, percentages, and other important values automatically.
Example: If cell A1 contains 10 and B1 contains 20, this formula adds them:
=A1+B1
Q6. What are Excel functions?
In Microsoft Excel, functions are predefined formulas that perform specific tasks automatically. They help users complete calculations quickly without writing long formulas. Common functions include SUM, AVERAGE, COUNT, IF, VLOOKUP, and XLOOKUP.
Example: To find the total of values in cells A1 to A5, you can use:
=SUM(A1:A5)
Q7. Explain the SUM function with a practical example
The SUM function is used to add multiple numbers quickly and accurately. Instead of adding values manually, data analysts use this function to calculate totals efficiently, saving time and reducing errors.
Example: To add values from cell A1 to A10, use the formula:
=SUM(A1:A10)
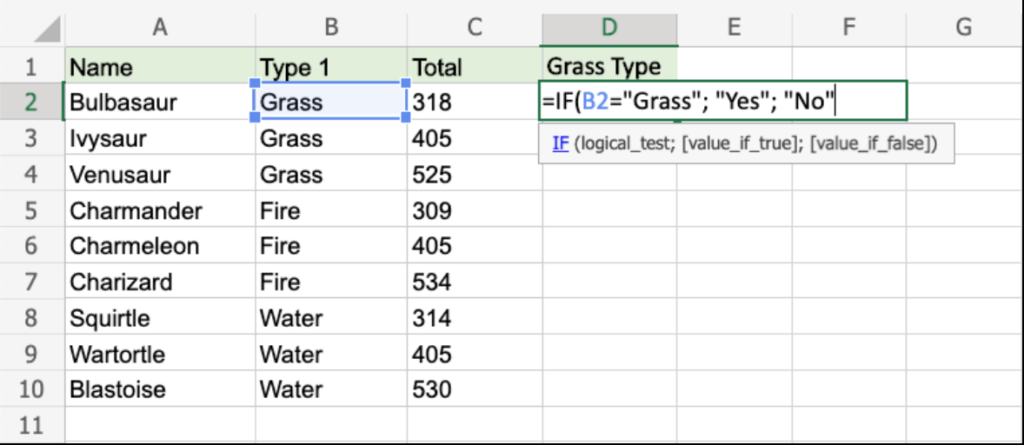
Q8. What is the IF function in Excel?
In Microsoft Excel, the IF function is a logical function that checks whether a condition is true or false and returns different results based on the outcome.
=IF(A1>=50,"Pass","Fail")
This formula checks if the value in cell A1 is 50 or more. If true, it returns Pass; otherwise, it returns Fail.
Data analysts use the IF function to categorise data, apply business rules, create flags, and build decision-based logic in reports and dashboards.
Q9. What is VLOOKUP?
VLOOKUP stands for Vertical Lookup. It is used to search for a value in the first column of a table and return a related value from another column in the same row. Data analysts commonly use VLOOKUP to match data from different tables, such as retrieving employee names using employee IDs or fetching product prices using product codes. VLOOKUP saves time, reduces manual errors, and improves accuracy in data analysis.
Q10. Difference between VLOOKUP and HLOOKUP
VLOOKUP searches data vertically in columns, while HLOOKUP searches data horizontally in rows. VLOOKUP is more commonly used because most datasets are arranged in columns. HLOOKUP is rarely used in real-world business scenarios. Understanding the difference helps data analysts select the correct lookup function based on how the data is structured.
Data Cleaning Excel Interview Questions
Q11. What is data cleaning in Excel?
Data cleaning is the process of identifying and fixing errors in raw data. This includes removing duplicates, correcting spelling mistakes, handling missing values, and standardising data formats.
Data analysts spend a large portion of their time cleaning data because incorrect data can lead to wrong insights and poor business decisions. Excel provides powerful tools like TRIM, Find and Replace, Remove Duplicates, and Text to Columns to make data cleaning easier and faster.
Q12. How do you remove duplicates in Excel?
Excel provides a built-in feature to remove duplicate records from a dataset.
Steps for removing data
Select the data
go to the Data tab
click on Remove Duplicates.
They can choose one or more columns to check for duplication. Removing duplicates is very important in data analysis because duplicate records can inflate numbers, distort results, and lead to incorrect conclusions.
Q13. What is Text to Columns?
Text to Columns is an Excel feature used to split data from one column into multiple columns based on a delimiter such as space, comma, or hyphen. For example, a full name column can be split into first name and last name.
Data analysts often use Text to Columns when working with imported data that is not properly structured.
Q14. What is the TRIM function?
The TRIM function removes extra spaces from text, except for single spaces between words. Extra spaces can cause problems in lookups, filtering, and comparisons.
For example, =TRIM(A1) cleans unwanted spaces in text data. Data analysts frequently use TRIM while cleaning data received from external sources such as CSV files or databases.
Sorting, Filtering, and Analysis Questions
Q15. What is sorting in Excel?
Sorting arranges data in a specific order, such as ascending or descending. For example, sorting sales data from highest to lowest helps identify top-performing products or regions. Data analysts use sorting to analyse rankings, trends, and performance metrics efficiently.
Q16. What is filtering in Excel?
Filtering displays only selected data based on specific conditions while hiding the rest. For example, a data analyst can filter sales data to show only transactions above a certain value. Filtering helps focus on relevant data without deleting or changing the original dataset.
Example: A data analyst can filter a sales table to show only transactions above ₹10,000 or sales from a specific region.
Filtering helps analysts focus on relevant data, identify patterns, and analyse information quickly without deleting or modifying the dataset.
Pivot Table and Advanced Excel Interview Questions
Q17. What is a Pivot Table?
A Pivot Table is one of the most powerful features in Excel. It allows data analysts to summarise, group, and analyse large datasets quickly without using complex formulas. Pivot Tables are commonly used to calculate total sales by region, revenue by product, or performance by time period. They make data analysis fast, flexible, and easy to understand.
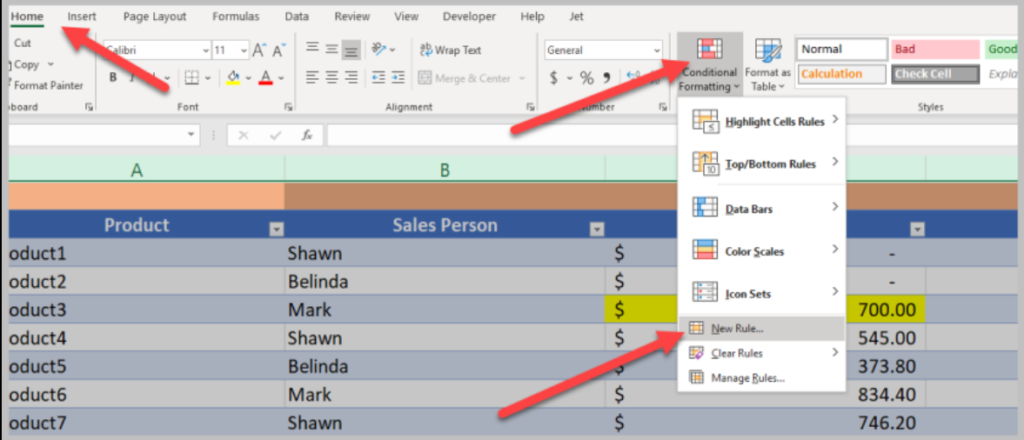
Q18. What is conditional formatting?
Conditional formatting allows cells to be formatted automatically based on certain rules. For example, values above a target can be highlighted in green, while low values can be highlighted in red. Data analysts use conditional formatting to quickly identify trends, outliers, and patterns in large datasets.
Q19. What are absolute and relative cell references?
In Microsoft Excel, relative cell references change automatically when a formula is copied to another cell. For example, A1 becomes A2 when copied down.
Absolute cell references remain fixed and use dollar signs, such as $A$1, so the reference does not change.
Example (Tax Calculation): If cell B1 contains a price and cell D1 contains a tax rate, use:
=B1*$D$1
Q20. What are Excel dashboards?
Excel dashboards are visual reports that combine charts, tables, and key metrics on a single screen. They provide a high-level summary of business performance and help management make quick decisions. Data analysts design dashboards to present insights clearly and effectively.
Conclusion
Excel remains a core skill for data analysts across various industries due to its simplicity, flexibility, and powerful analysis capabilities. A strong understanding of Excel interview questions for data analyst roles helps candidates confidently handle real-world data challenges during interviews and on the job.
From basic formulas and data cleaning to advanced tools like Pivot Tables and dashboards, Excel plays a crucial role in transforming raw data into meaningful insights.
By regularly practising these Excel interview questions and answers for a data analyst, you can improve your analytical thinking, problem-solving skills, and increase your chances of cracking data analyst interviews successfully.